1) Natural geography
|
Area > Comparative to US places slightly smaller than Maryland |
||
| Capital city with population | Bujumbura - 300,000 | |
| Forested Land | 3.7% | [169th of 193] |
| Geographic coordinates | 3 30 S, 30 00 E | |
| Largest city | Bujumbura | |
| Largest city population | 278,000 | [129th of 174] |
| Largest city with population | Bujumbura - 300,000 | |
| northernmost point > Latitude | 02°18'S | |
| Population density | 223.62 people per sqkm | [51st of 256] |
| Population density > people per sq. km | 293.91 people/m² | [32nd of 204] |
| Rural population density > rural population per sq. km of arable land | 643.68 people/km² of arable lan | [36th of 188] |
| Surface area > sq. km | 27,830 km² | [142nd of 206] |
| tallest mountains > Mountain | south east of Heha | |
| Acidification | 0% | [103rd of 141] |
| Adjusted savings: carbon dioxide damage > % of GNI | 0.23 % of GNI | [125th of 179] |
| Adjusted savings: net forest depletion > % of GNI | 11.32 % of GNI | [1st of 57] |
| Adjusted savings: particulate emission damage > % of GNI | 0.12 % of GNI | [128th of 165] |
| Areas under protection | 13 | [103rd of 146] |
| Breeding birds threatened | 1.55% | [95th of 136] |
| Carbon efficiency | 0.16 CO2 emissions/$ GDP | [134th of 141] |
| CFC consumption | 643.81 | [66th of 107] |
| CO2 Emissions | 240 | [161st of 178] |
| CO2 emissions > kg per 2000 PPP $ of GDP | 0.06 kg/PPP$ | [153rd of 170] |
| CO2 emissions > kt | 234.43 kt | [180th of 195] |
| CPIA policy and institutions for environmental sustainability rating | 2.5 | [72nd of 75] |
| Ecological footprint | 0.75 | [138th of 141] |
| Endangered species protection | 27.3% | [102nd of 141] |
| Fertiliser consumption | 26.92 hundred grams/hectare | [127th of 141] |
| Forest area > % of land area | 5.92 % of land area | [165th of 195] |
| Forest area > sq. km | 1,520 km² | [155th of 195] |
| Freshwater withdrawal | 0.29 | [105th of 124] |
| Freshwater withdrawal > Agricultural | 77% | [56th of 124] |
| Freshwater withdrawal > Domestic | 17% | [58th of 124] |
| Freshwater withdrawal > Industrial | 6% | [62nd of 124] |
| Groundwater withdrawals | 0 | [150th of 188] |
| Known breeding bird species | 145 | [115th of 146] |
| Known mammal species | 107 | [80th of 145] |
| Marine areas under protection | 1 | [86th of 95] |
| Marine fish catch | 0 tons | [125th of 141] |
| Non-wildness | 0.77% | [110th of 141] |
| NOx emissions per populated area | 0.23 thousand metric tons/squ | [71st of 141] |
| Organic water pollutant (BOD) emissions > kg per day | 1,644.07 kg/day | [107th of 115] |
| Organic water pollutant (BOD) emissions > kg per day per worker | 0.24 kg per day per worker | [21st of 115] |
| PM10, country level > micrograms per cubic meter | 38.92 mcg/m³ | [92nd of 185] |
| Pollution > Carbon dioxide 1999 | 66 | [173rd of 199] |
| Protected area | 5.6 | [73rd of 147] |
| SO2 emissions per populated area | 130 thousand metric tons/squ | [116th of 141] |
| SO2 exports | 1,142.39 hundred metric tons | [77th of 141] |
| Threatened species | 14 | [120th of 158] |
| Threatened species > Mammal | 5 | [125th of 160] |
| Total renewable water resources | 3.6 cu km | [17th of 31] |
| Urban NO2 concentration | 22.28 micrograms/m3 | [130th of 141] |
| Urban SO2 concentration | 104.1 micrograms/m3 | [22nd of 141] |
| Water > Availability | 0.65 thousand cubic metres | [115th of 141] |
| Water > Dissolved oxygen concentration | 3.94 mls/litre | [137th of 141] |
| Water > Phosphorus concentration | 0.68 mls/litre | [11th of 141] |
| Water > Salinisation | 237.91 | [118th of 141] |
| Water > Severe water stress | 0 | [118th of 140] |
| Water > Suspended solids | 5.57 mls/litre | [55th of 141] |
| Water pollution, chemical industry > % of total BOD emissions | 4.72 % | [86th of 114] |
| Water pollution, clay and glass industry > % of total BOD emissions | 0.08 % | [106th of 112] |
| Water pollution, food industry > % of total BOD emissions | 67.78 % | [16th of 114] |
| Water pollution, other industry > % of total BOD emissions | 0.8 % | [99th of 107] |
| Water pollution, paper and pulp industry > % of total BOD emissions | 8.3 % | [77th of 111] |
| Water pollution, textile industry > % of total BOD emissions | 16.69 % | [39th of 114] |
| Water pollution, wood industry > % of total BOD emissions | 1.63 % | [66th of 114] |
| Wetlands of intl importance > Area | 1 thousand hectares | [110th of 112] |
| Wildness | 5.13% | [67th of 141] |
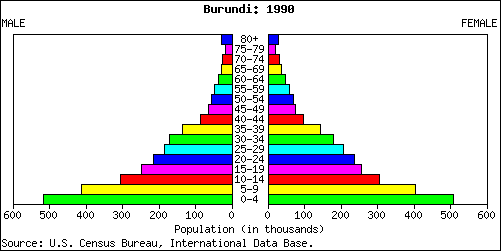
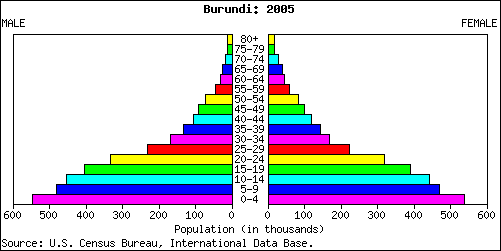
Age and sex distribution for the year 1990:
| Compensation of employees > % of expense | 36.81 % | [19th of 97] |
| Compensation of employees > current LCU | 22000000000 | |
| CPIA building human resources rating | 3 | [59th of 75] |
| Economic activity > Both sexes aged 10-14 | 48.5 | [3rd of 89] |
| Economic activity > Both sexes aged 15-19 | 82.47 | [2nd of 167] |
| Economic activity > Both sexes aged 20-24 | 90.61 | [3rd of 166] |
| Economic activity > Both sexes aged 25-29 | 92.97 | [11th of 167] |
| Economic activity > Both sexes aged 30-34 | 94.22 | [15th of 165] |
| Economic activity > Both sexes aged 35-39 | 94.3 | [19th of 166] |
| Economic activity > Both sexes aged 40-44 | 94.01 | [21st of 167] |
| Economic activity > Both sexes aged 45-49 | 93.23 | [16th of 163] |
| Economic activity > Both sexes aged 50-54 | 88.62 | [14th of 166] |
| Economic activity > Both sexes aged 55-59 | 82.69 | [18th of 166] |
| Economic activity > Both sexes aged 60-64 | 72.45 | [18th of 166] |
| Economic activity > Both sexes aged 65 plus | 50.05 | [22nd of 165] |
| Economic activity > Men aged 10-14 | 52.1 | [3rd of 92] |
| Economic activity > Men aged 15-19 | 83.78 | [2nd of 164] |
| Economic activity > Men aged 20-24 | 94.12 | [3rd of 166] |
| Economic activity > Men aged 25-29 | 97.5 | [11th of 165] |
| Economic activity > Men aged 30-34 | 98.19 | [24th of 165] |
| Economic activity > Men aged 35-39 | 98.19 | [33rd of 164] |
| Economic activity > Men aged 40-44 | 97.79 | [30th of 163] |
| Economic activity > Men aged 45-49 | 97.69 | [21st of 167] |
| Economic activity > Men aged 50-54 | 96.34 | [22nd of 165] |
| Economic activity > Men aged 55-59 | 94.85 | [13th of 167] |
| Economic activity > Men aged 60-64 | 91.28 | [9th of 165] |
| Economic activity > Men aged 65 plus | 74.04 | [14th of 162] |
| Economic activity > Women aged 10-14 | 44.91 | [4th of 89] |
| Economic activity > Women aged 15-19 | 81.17 | [2nd of 164] |
| Economic activity > Women aged 20-24 | 87.15 | [3rd of 166] |
| Economic activity > Women aged 25-29 | 88.55 | [14th of 165] |
| Economic activity > Women aged 30-34 | 90.39 | [17th of 167] |
| Economic activity > Women aged 35-39 | 90.59 | [21st of 165] |
| Economic activity > Women aged 40-44 | 90.49 | [21st of 165] |
| Economic activity > Women aged 45-49 | 89.23 | [20th of 161] |
| Economic activity > Women aged 50-54 | 82.44 | [20th of 166] |
| Economic activity > Women aged 55-59 | 73.71 | [18th of 167] |
| Economic activity > Women aged 60-64 | 59.28 | [18th of 165] |
| Economic activity > Women aged 65 plus | 34.73 | [20th of 167] |
| Economically active children, female | 35.68 % | [9th of 34] |
| Economically active children, male | 38.38 % | [11th of 34] |
| Economically active children, study and work | 51.68 % | [27th of 34] |
| Economically active children, study and work, female | 48.07 % | [25th of 34] |
| Economically active children, study and work, male | 55.38 % | [28th of 34] |
| Economically active children, total | 36.96 % | [9th of 34] |
| Economically active children, work only | 48.32 % | [8th of 34] |
| Economically active children, work only, female | 51.93 % | [10th of 33] |
| Economically active children, work only, male | 44.62 % | [7th of 34] |
| Female economic activity | 82% | [3rd of 156] |
| Female economic activity growth | -1% | [125th of 156] |
| Firing cost > weeks of wages | 26 weeks of wages | [115th of 164] |
| force participation rate, female > % of female population ages 15-64 | 92.81 % | [1st of 184] |
| force participation rate, male > % of male population ages 15-64 | 93.24 % | [5th of 184] |
| force participation rate, total > % of total population ages 15-64 | 93.02 % | [1st of 184] |
| force, female > % of total labor force | 51.93 % | [2nd of 184] |
| force, total | 3,834,790 | [87th of 184] |
|
Labor
force > By occupation agriculture 93.6%, industry 2.3%, services 4.1% |
||
| Minimum Age Convention, 1973 > Ratifications > Date | July 19, 2000 | |
| Minimum Age Convention, 1973 > Ratifications > Minimum age | 16 | [21st of 146] |
| Parental leave > Paid maternity leave | 12 weeks | |
| Regulation | 62 | [27th of 123] |
| Regulation > Employment Conditions | 76 | [60th of 123] |
| Regulation > Firing | 51 | [27th of 123] |
| Regulation > Hiring | 58 | [37th of 123] |
| Right to Organise and Collective Bargaining Convention > Ratifications > Date | October 10, 1997 | |
| Rigidity of employment index | 59 | [24th of 166] |
| skills > % of managers surveyed ranking this as a major business constraint | 0.14 % | [22nd of 38] |
| Technicians in R&D > per million people | 31.67 per million people | [10th of 49] |
| Unemployment, female > % of female labor force | 0.3 % | [58th of 95] |
| Unemployment, male > % of male labor force | 0.7 % | [57th of 95] |
| Unemployment, total > % of total labor force | 0.5 % | [64th of 101] |
| Workers' remittances and compensation of employees, paid > US$ | 1,000,000 $ | [142nd of 149] |
| Workers' remittances and compensation of employees, paid > US$ (per $ GDP) | 1.25 $ per $1,000 of GDP | [114th of 166] |
| Workers' remittances, receipts > BoP, current US$ | 71,562.16 BoP $ | [100th of 115] |
| Workers' remittances, receipts > BoP, current US$ (per $ GDP) | 0.089 BoP $ per $1 million of | [92nd of 142] |
| African countries by population density > area | 27,830 | [44th of 56] |
| African countries by population density > pop. dens. | 229 | [6th of 56] |
| African countries by population density > population | 6,373,002 | [31st of 56] |
| Age dependency ratio > dependents to working-age population | 0.91 | [16th of 185] |
| Age structure > 0-14 years | 46 | [13th of 226] |
| Age structure > 0-14 years > Females | 1,998,502 | [72nd of 225] |
| Age structure > 0-14 years > From total | 46.3% | [8th of 227] |
| Age structure > 0-14 years > Males | 2,021,320 | [74th of 225] |
| Age structure > 15-64 years | 51.3 | [215th of 226] |
| Age structure > 15-64 years > Females | 2,240,921 | [96th of 225] |
| Age structure > 15-64 years > From total | 51.2% | [213rd of 227] |
| Age structure > 15-64 years > Males | 2,210,157 | [98th of 225] |
| Age structure > 65 years and over > Females | 132,505 | [123rd of 225] |
| Age structure > 65 years and over > From total | 2.5% | [207th of 227] |
| Age structure > 65 years and over > Males | 87,600 | [132nd of 225] |
| Child Protection > Birth registration, % of rural | 75 | [17th of 52] |
| Child Protection > Birth registration, % of total | 75 | [22nd of 56] |
| Child Protection > Birth registration, % of urban | 71 | [35th of 52] |
| Child Protection > Child labour 5-14 years, % of female | 23 | [24th of 46] |
| Child Protection > Child labour 5-14 years, % of male | 26 | [22nd of 46] |
| Child Protection > Child labour 5-14 years, % of poorest 20% | 27 | [28th of 43] |
| Child Protection > Child labour 5-14 years, % of richest 20% | 19 | [11th of 43] |
| Child Protection > Child labour 5-14 years, % of rural | 25 | [28th of 42] |
| Child Protection > Child labour 5-14 years, % of total | 24 | [23rd of 46] |
| Child Protection > Child labour 5-14 years, % of urban | 12 | [26th of 42] |
| CPIA social protection rating | 3 | [55th of 75] |
| Female population > Age 10-14 | 517,559 | [76th of 224] |
| Female population > Age 10-14 > % of the total | 6.4 | [19th of 224] |
| Female population > Age 15-19 | 451,184 | [80th of 224] |
| Female population > Age 15-19 > % of the total | 5.58 | [36th of 224] |
| Female population > Age 20-24 | 378,887 | [84th of 224] |
| Female population > Age 20-24 > % of the total | 4.68 | [70th of 224] |
| Female population > Age 25-29 | 299,392 | [91st of 224] |
| Female population > Age 25-29 > % of the total | 3.7 | [135th of 224] |
| Female population > Age 30-34 | 227,785 | [102nd of 224] |
| Female population > Age 30-34 > % of the total | 2.82 | [205th of 224] |
| Female population > Age 35-39 | 173,452 | [109th of 224] |
| Female population > Age 35-39 > % of the total | 2.14 | [209th of 224] |
| Female population > Age 40-44 | 149,271 | [112nd of 224] |
| Female population > Age 40-44 > % of the total | 1.85 | [210th of 224] |
| Female population > Age 45-49 | 136,979 | [112nd of 224] |
| Female population > Age 45-49 > % of the total | 1.69 | [198th of 224] |
| Female population > Age 50-54 | 119,082 | [109th of 224] |
| Female population > Age 50-54 > % of the total | 1.47 | [185th of 224] |
| Female population > Age 55-59 | 85,962 | [113rd of 224] |
| Female population > Age 55-59 > % of the total | 1.06 | [201st of 224] |
| Female population > Age 60-64 | 60,023 | [119th of 224] |
| Female population > Age 60-64 > % of the total | 0.74 | [207th of 224] |
| Female population > Age 65-69 | 48,990 | [120th of 224] |
| Female population > Age 65-69 > % of the total | 0.61 | [201st of 224] |
| Female population > Age 70-74 | 36,677 | [123rd of 224] |
| Female population > Age 70-74 > % of the total | 0.45 | [192nd of 224] |
| Female population > Age 75-79 | 22,081 | [127th of 224] |
| Female population > Age 75-79 > % of the total | 0.27 | [192nd of 224] |
| Female population > Age 80-84 | 17,395 | [121st of 224] |
| Female population > Age 80-84 > % of the total | 0.22 | [175th of 224] |
| Gender development | 0.306 | [141st of 141] |
| Male population > Age 10-14 | 521,481 | [76th of 224] |
| Male population > Age 10-14 > % of the total | 6.45 | [24th of 224] |
| Male population > Age 15-19 | 454,354 | [81st of 224] |
| Male population > Age 15-19 > % of the total | 5.62 | [48th of 224] |
| Male population > Age 20-24 | 383,630 | [83rd of 224] |
| Male population > Age 20-24 > % of the total | 4.74 | [80th of 224] |
| Male population > Age 25-29 | 304,991 | [90th of 224] |
| Male population > Age 25-29 > % of the total | 3.77 | [136th of 224] |
| Male population > Age 30-34 | 238,903 | [101st of 224] |
| Male population > Age 30-34 > % of the total | 2.95 | [209th of 224] |
| Male population > Age 35-39 | 185,098 | [105th of 224] |
| Male population > Age 35-39 > % of the total | 2.29 | [213rd of 224] |
| Male population > Age 40-44 | 148,927 | [110th of 224] |
| Male population > Age 40-44 > % of the total | 1.84 | [208th of 224] |
| Male population > Age 45-49 | 124,193 | [112nd of 224] |
| Male population > Age 45-49 > % of the total | 1.54 | [198th of 224] |
| Male population > Age 50-54 | 100,140 | [111st of 224] |
| Male population > Age 50-54 > % of the total | 1.24 | [186th of 224] |
| Male population > Age 55-59 | 67,334 | [120th of 224] |
| Male population > Age 55-59 > % of the total | 0.83 | [204th of 224] |
| Male population > Age 60-64 | 43,881 | [126th of 224] |
| Male population > Age 60-64 > % of the total | 0.54 | [219th of 224] |
| Male population > Age 65-69 | 34,131 | [130th of 224] |
| Male population > Age 65-69 > % of the total | 0.42 | [219th of 224] |
| Male population > Age 70-74 | 24,597 | [128th of 224] |
| Male population > Age 70-74 > % of the total | 0.3 | [214th of 224] |
| Male population > Age 75-79 | 14,216 | [132nd of 224] |
| Male population > Age 75-79 > % of the total | 0.18 | [212nd of 224] |
| Male population > Age 80-84 | 10,488 | [124th of 224] |
| Male population > Age 80-84 > % of the total | 0.13 | [191st of 224] |
| Percentage living in rural areas. | 90% | [2nd of 193] |
| Percentage living in urban areas | 10% | [198th of 199] |
| Population > CIA Factbook | 8,691,005 | [90th of 240] |
| Population ages 0-14 > % of total | 45.01 % | [14th of 185] |
| Population ages 15-64 > % of total | 52.27 % | [169th of 185] |
| Population ages 65 and above > % of total | 2.72 % | [165th of 185] |
| Population growth > annual % | 3.58 annual % | [5th of 195] |
| Population, female > % of total | 51.2 % | [46th of 190] |
| Projected population growth | 158.47% | [19th of 141] |
| Rights of the Child Convention > Ratification Dates | 19 Oct 1990 | |
| Rights of the Child Convention > Signatories | 8 May 1990 | |
| Rural population | 6,792,764 | [63rd of 193] |
| Rural population growth > annual % | 3.27 annual % | [6th of 193] |
| Sex ratio > 15-64 years | 0.98 | [149th of 223] |
| Sex ratio > sex ratios > 15–65 | 0.99 | [138th of 215] |
| Sex ratio > sex ratios > at birth | 1.03 | [193rd of 215] |
| Sex ratio > sex ratios > over 65 | 0.67 | [178th of 215] |
| Sex ratio > sex ratios > total | 0.99 | [109th of 215] |
| Sex ratio > sex ratios > under 15 | 1.01 | [186th of 215] |
| Total Population | 8,090,068 | [91st of 227] |
| Total population > Age 10-14 | 1,039,040 | [76th of 224] |
| Total population > Age 10-14 > % of the total | 12.84 | [23rd of 224] |
| Total population > Age 15-19 | 905,538 | [81st of 224] |
| Total population > Age 15-19 > % of the total | 11.19 | [45th of 224] |
| Total population > Age 20-24 | 762,517 | [83rd of 224] |
| Total population > Age 20-24 > % of the total | 9.43 | [76th of 224] |
| Total population > Age 25-29 | 604,383 | [91st of 224] |
| Total population > Age 25-29 > % of the total | 7.47 | [137th of 224] |
| Total population > Age 30-34 | 466,688 | [102nd of 224] |
| Total population > Age 30-34 > % of the total | 5.77 | [210th of 224] |
| Total population > Age 35-39 | 358,550 | [107th of 224] |
| Total population > Age 35-39 > % of the total | 4.43 | [213rd of 224] |
| Total population > Age 40-44 | 298,198 | [111st of 224] |
| Total population > Age 40-44 > % of the total | 3.69 | [208th of 224] |
| Total population > Age 45-49 | 261,172 | [112nd of 224] |
| Total population > Age 45-49 > % of the total | 3.23 | [197th of 224] |
| Total population > Age 50-54 | 219,222 | [110th of 224] |
| Total population > Age 50-54 > % of the total | 2.71 | [190th of 224] |
| Total population > Age 55-59 | 153,296 | [115th of 224] |
| Total population > Age 55-59 > % of the total | 1.89 | [208th of 224] |
| Total population > Age 60-64 | 103,904 | [124th of 224] |
| Total population > Age 60-64 > % of the total | 1.28 | [214th of 224] |
| Total population > Age 65-69 | 83,121 | [125th of 224] |
| Total population > Age 65-69 > % of the total | 1.03 | [214th of 224] |
| Total population > Age 70-74 | 61,274 | [125th of 224] |
| Total population > Age 70-74 > % of the total | 0.76 | [206th of 224] |
| Total population > Age 75-79 | 36,297 | [129th of 224] |
| Total population > Age 75-79 > % of the total | 0.45 | [199th of 224] |
| Total population > Age 80-84 | 27,883 | [124th of 224] |
| Total population > Age 80-84 > % of the total | 0.34 | [186th of 224] |
| Total Population > Female | 4,070,360 | [92nd of 227] |
| Total Population > Male | 4,019,708 | [90th of 227] |
| Urban population | 754,751.5 | [146th of 195] |
| Urban population growth > annual % | 6.42 annual % | [3rd of 195] |
| Urbanization | 9 | [202nd of 204] |
| Urbanization in 1975 | 3.2% | [165th of 164] |
| Urbanization in 2015 | 14.5% | [163rd of 164] |
| Women > Adult literacy rate females as a % of males | 72 | [110th of 144] |
| Women > Antenatal care coverage % | 78 | [88th of 133] |
| Women > Contraceptive prevalence % | 16 | [147th of 170] |
| Women > Life expectancy females as a % of males | 103 | [151st of 173] |
| Women > Maternal mortality ratio adjusted | 1,000 | [15th of 166] |
| Women > Skilled attendant at delivery % | 25 | [160th of 172] |
| Death rate, crude > per 1,000 people | 18.2 per 1,000 people | [20th of 195] |
| rate, adult, female > per 1,000 female adults | 492.36 per 1,000 female adults | [17th of 185] |
| rate, adult, male > per 1,000 male adults | 512.38 per 1,000 male adults | [13th of 185] |
| rate, infant > per 1,000 live births | 114 per 1,000 live births | [14th of 187] |
| rate, under-5 > per 1,000 | 190 per 1,000 | [16th of 187] |
| immigrant population > Immigrants as percentage of state population | 1.325 | [140th of 195] |
| immigrant population > Number of immigrants | 100,000 | [123rd of 195] |
| immigrant population > Percentage of total number of immigrants in the world | >0.1% | |
| Net migration rate | 5.62 migrant(s)/1,000 populati | [21st of 225] |
| Refugees | 250,550 | [17th of 110] |
| Refugees > Convention on refugees | 19 Jul 1963 a | |
| Refugees > Outflow | 568,000 | [1st of 76] |
| Refugees > US acceptance rates | 7.5 | [45th of 49] |
| Refugees > US applications | 80 | [24th of 64] |
| Refugees > US applications approved | 6 | [34th of 53] |
| Refugees > US applications otherwise closed | 0 | [37th of 39] |
| Refugees and internally displaced persons > IDPs | 100,000 | [19th of 40] |
|
Refugees and internally displaced persons > Refugees (country of
origin) 9,849 (Democratic Republic of the Congo) |
||
| US visa lottery winners | 27 US visa lottery winners | [108th of 178] |


| Other articles in this category |
|---|
| Brundi at a glance |
| Geography |
| History |
| Culture |
| Economy (1) |
| Economy (2) |
| Politics |
| Military |